

1:500 existing-conditions topographic survey in Ho Chi Minh City: why a 2026 deliverable needs UAV, laser scanning, RTK and levelling together
A 1:500 existing-conditions topographic survey in 2026 no longer stops at contour lines and land boundaries. Owners and review authorities now also ask for floor-by-floor plans, storey heights, several alternative ways of computing building footprint area, utility invert levels, and attributes for every manhole, power pole and utility cabinet — all on a single VN2000 coordinate system and Hon Dau vertical datum. 3DSCAN Technology Company Limited, headquartered in Ho Chi Minh City, meets that volume of information by combining GNSS RTK, digital levelling, UAV LiDAR, terrestrial laser scanning (TLS), SLAM and a utility-survey application developed in-house by 3DSCAN, rather than measuring point by point with a single instrument. Our aerial survey approach is described in detail on the 3D topographic survey by UAV page.
1. Why conventional topographic survey no longer covers a 2026 deliverable
A conventional survey with total station and GNSS records only the points the surveyor chose to shoot, so it cannot answer questions that arise after the crew has left the site. When a deliverable calls for several data layers at once, every new question triggers another field visit — more time, more cost, and worse, another case of measurements taken on two different dates being merged into one drawing. The table below maps each requirement against the two approaches.
Deliverable requirements and how each approach meets them
| Requirement | Conventional survey | Combined technologies |
|---|---|---|
| 1:500 terrain, carriageway, kerbs | Detail points shot by total station or RTK, limited to what the surveyor selected | UAV LiDAR and UAV imagery cover the whole surface; RTK and total station verify and infill |
| Floor plans, elevations, storey heights | Tape measurements or reflectorless total station, point by point | Laser scanning indoors and outdoors, SLAM for corridors and tight spaces |
| Several alternative area calculations | Usually only a measurement at the wall base | Multiple outlines extracted from the same point cloud |
| Manholes, power poles, utility cabinets | Field notebooks and loose drawings, hard to retrieve | 3DSCAN's utility-survey application ties RTK coordinates, attributes and photos into one GIS database |
| Utility levels | Isolated shots, accumulated error hard to control | Levelling controls the vertical network; manhole covers tied to the Hon Dau datum |
| Questions raised after fieldwork | A return visit to take additional measurements | Reopen the point cloud and site photos to extract the new dimension |
2. One building, several footprint figures — and nobody is wrong
The same building can yield three different footprint figures, depending on where it is measured. A topographic map takes the wall base. Architectural and planning documents use the horizontal projection, including balconies, roof overhangs and gutters. The two methods differ at the point of measurement itself, so a discrepancy between the two datasets is not an error on either side.
A is the wall base (smallest), B is the balcony edge, C is the roof and gutter edge (largest). The entire difference lies in the projecting elements.
The regulations themselves are not perfectly consistent. Answering a citizen enquiry on 12 March 2021 in the Government e-Newspaper, Vietnam's Ministry of Construction stated: “The land-occupied area is the area of the horizontal projection of the building roof” (Clause 1.4.20, QCVN 01:2019). QCVN 01:2021/BXD later allowed eaves gutters (sê-nô), awnings (ô-văng), projecting eaves, entrance canopies, steps, window sills and skybridge corridors to be excluded — but balconies do not appear on that list.
The surveyor's job is therefore to measure enough that every calculation method can be verified. We use 3D laser scanning of existing architecture to capture a single point cloud, extract all three outlines from it at once, and deliver a comparison table of the resulting areas.
3. Utilities: the data volume has outgrown the field notebook
Utilities account for the largest share of information in an existing-conditions deliverable, because every object needs coordinates, levels and attributes. A site of a few hectares in inner-city Ho Chi Minh City easily holds hundreds of such objects:
- Drainage: manholes, pipe diameter and alignment, manhole rim level, pipe crown and invert levels.
- Power supply: 22 kV, 0.4 kV and street-lighting cables, overhead or buried; substations, LV cabinets, poles.
- Water supply and telecoms: pipe diameter, valve chambers, cable pits, communication cabinets.
The utility-survey application developed in-house by 3DSCAN records every object into a database on site: GNSS RTK coordinates, a photograph, object type, dimensions, and whether it is overhead or buried. The data imports straight into GIS and exports as separate layers, following the same approach as our conversion and standardisation of planning data into GIS service. When a manhole needs to be re-checked, the engineer opens the record and cross-references the point cloud instead of returning to site — exactly what our motto “The real world within reach” means in practice.
A limit to state clearly in the quotation: a ground survey only captures what is visible. Buried alignments, pipe diameters and invert levels require as-built records from the owner, or dedicated detection equipment — as in the Scan to BIM with underground utility detection at RMIT District 7 project.
4. Each technology does one job, on one common coordinate frame
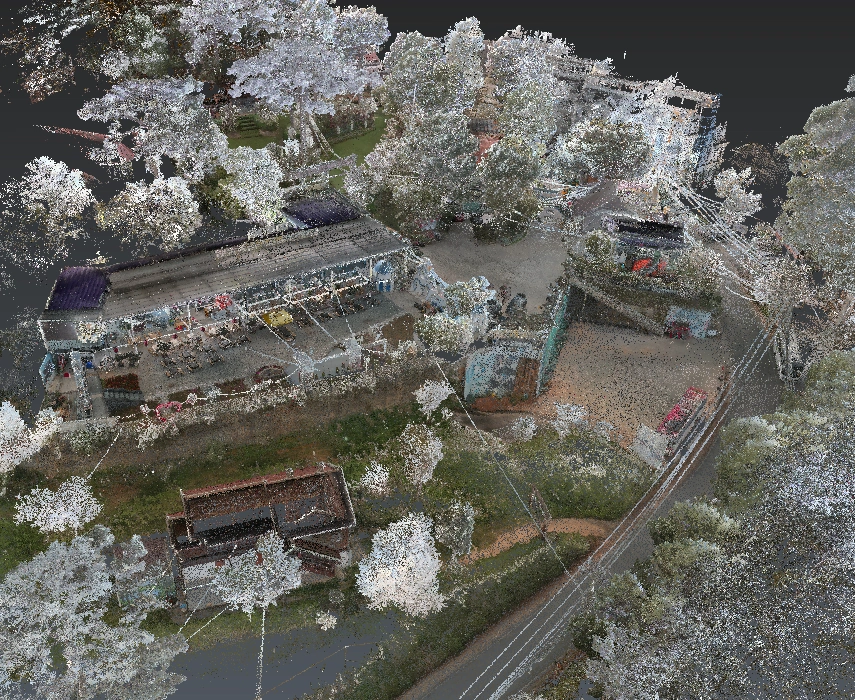
No single technology can produce the whole deliverable, because each one performs best on a particular kind of ground. GNSS RTK and levelling establish the horizontal and vertical frame. UAV covers wide areas and building roofs. Terrestrial laser scanning captures façade detail and interior space. SLAM fills the places TLS and UAV cannot reach. 3DSCAN's utility-survey application gathers every attribute. The value lies in all five data sources being tied to the same control network, so they merge into one drawing without any datum correction.
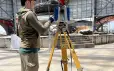
Four groups of equipment working on the same site, each covering ground the others cannot reach. Order of work: establish control points with GNSS RTK and levelling first, then capture data with UAV LiDAR, terrestrial laser scanning and SLAM, survey utilities with the 3DSCAN application, and finally merge everything into a 1:500 map on the VN2000 system and Hon Dau datum.
a. Control by GNSS and levelling — the step that determines the whole deliverable
The control network determines whether everything measured afterwards will fit together. We bring VN2000 coordinates and Hon Dau levels onto the site through a fourth-order network and a second-order traverse, with levelling carried out under QCVN 11:2008/BTNMT on the establishment of vertical control networks. All UAV, TLS and SLAM data is then registered to those same monuments, so the topographic map and the building drawings share one coordinate origin.
“The control network determines the whole deliverable. If the fourth-order network and the levelling are not sound, UAV, laser scan and SLAM data will not register correctly onto a single VN2000 frame, no matter how accurate each dataset is.”
— Phan Tien Duyen, Director, 3DSCAN Technology Company Limited
b. UAV for wide areas, laser scanning and SLAM for buildings
A UAV covers the site and the roofs in a short flight, while TLS captures the facade detail and interior space the UAV cannot see. Handheld SLAM reaches the places where setting up a TLS station is impractical: narrow corridors, stairwells, the void beneath a roof overhang. Merging these three data sources follows our 3D modelling with UAV and laser scanning workflow within a single coordinate frame. Where an information model is required, the same dataset carries forward into Scan to BIM without a single additional site visit.
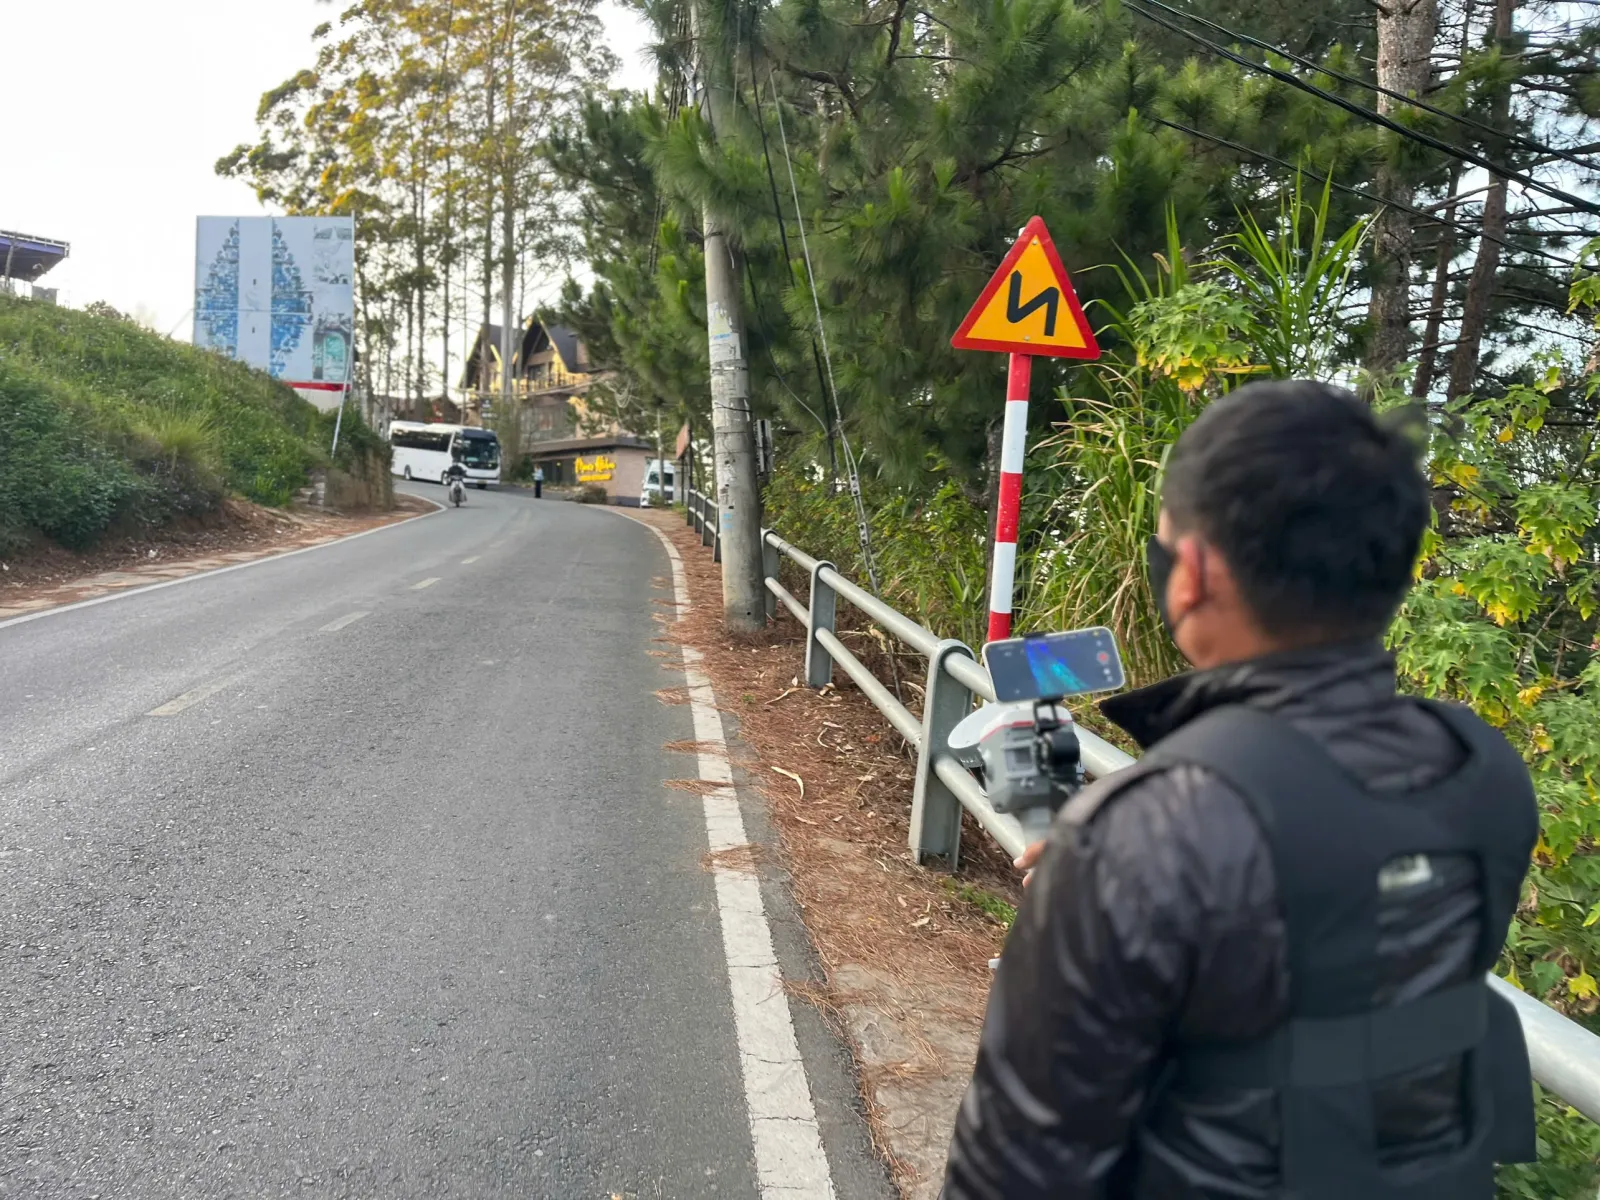
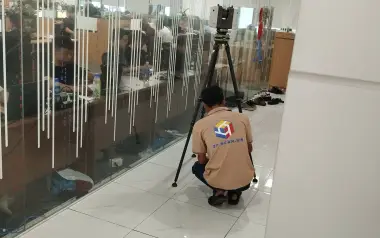
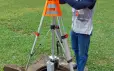
A 3DSCAN engineer establishing horizontal control with GNSS RTK before the UAV flight and laser scanning.
5. What a complete existing-conditions deliverable contains
A 1:500 topographic and existing-conditions deliverable comprises the map, the building drawings and the utility database, all on the VN2000 system and Hon Dau datum:
- 1:500 existing-conditions topographic map: contour lines, carriageway, kerbs, trees, grassed areas and the area of each zone.
- Building drawings: floor plans for each storey, elevations, sections, storey heights, and an area schedule under each calculation method.
- Utility layers: drainage, water supply, power and telecoms — each system as its own layer with an attribute table.
- Existing boundary: coordinates and areas measured on site; title-deed and planning boundaries overlaid from records supplied by the owner.
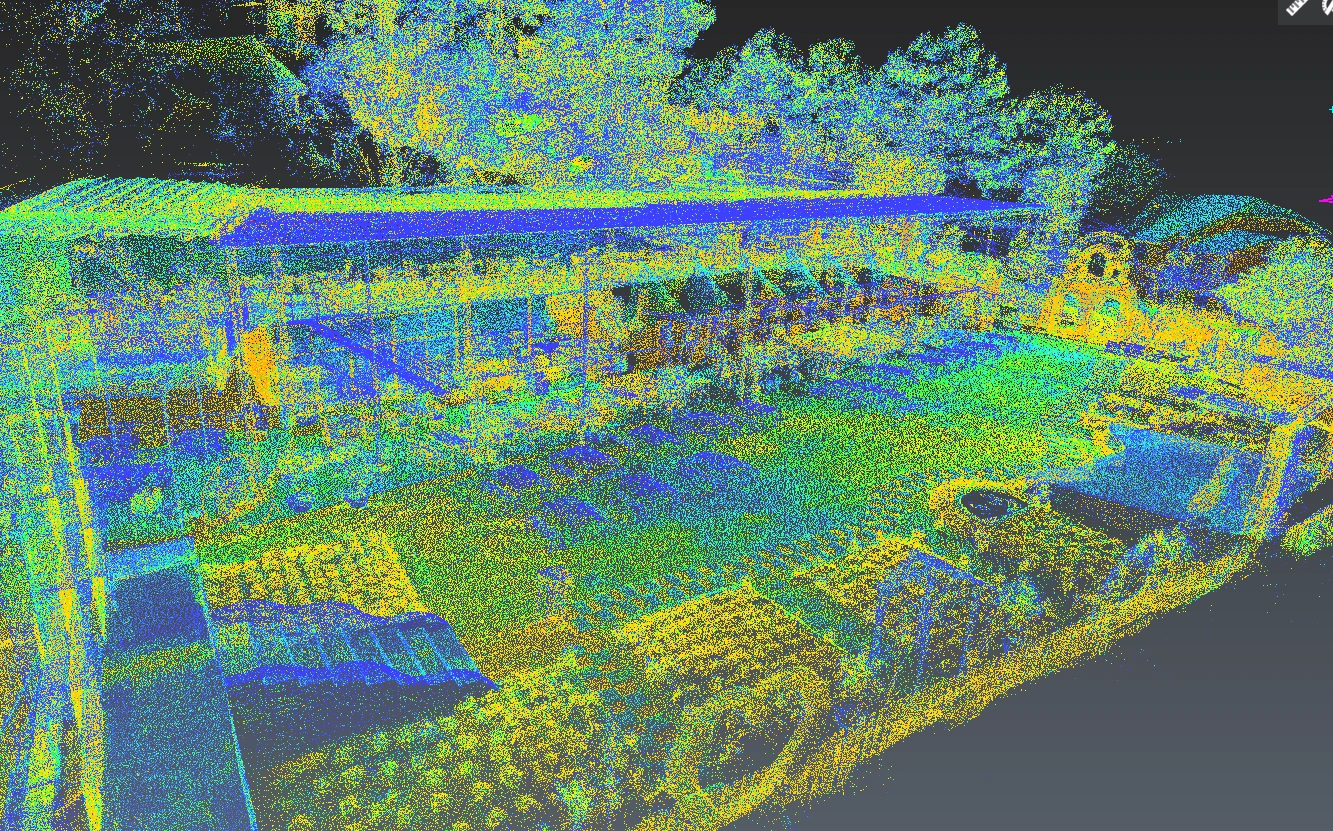
- Point data and report: the original point cloud (LAS/LAZ/E57) and a technical report with the accuracy check results.
6. What this deliverable can actually be used for
The value of the dataset lies in how many times it can be reused, not in a map submitted once. The same existing-conditions deliverable supports:
- 1:500 detailed planning: terrain base, existing boundary and existing utilities for calculating building density and floor area ratio.
- Renovation and extension design: architects take plan dimensions and storey heights straight from the data instead of tape-measuring each room on site.
- Review and justification: every area figure has a corresponding outline and measured point to cite when the review authority asks.
- Connecting-utility design: manhole rim levels and alignments are already in GIS, ready for drainage, water and power connections.
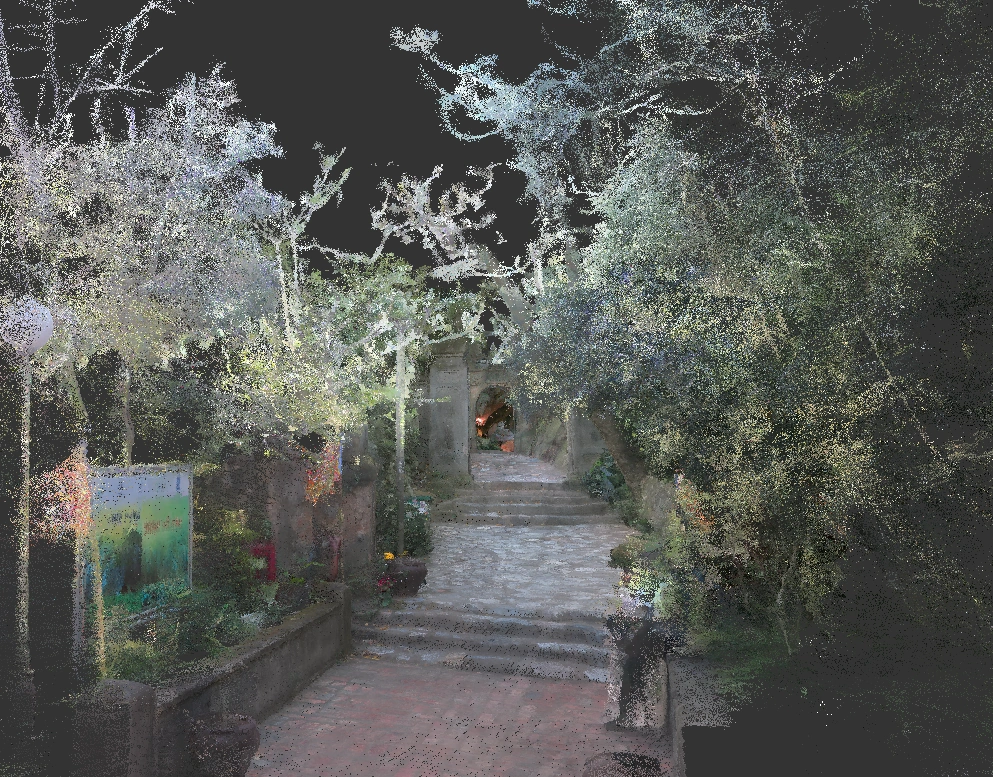
- Carry-forward to BIM and facility management: the original point cloud is reused for an as-built BIM model with no resurvey.
7. Conclusion
A 2026 existing-conditions deliverable demands a dataset usable for planning, design and review alike, not just a map filed to complete a procedure. That is achievable only when the control network is sound, the capture technologies complement each other on one coordinate frame, and every accuracy figure is backed by a check point. 3DSCAN is headquartered in Ho Chi Minh City, has delivered survey projects in provinces and cities across Vietnam, and is ready to discuss survey scope and the list of utility records the owner needs to supply before quoting.
Related projects by 3DSCAN
- Scan to BIM with underground utility detection at RMIT District 7 — terrain, buildings and buried utilities integrated on one coordinate frame.
- 3D model of the Tan Hue Vien resort — survey and modelling across a large site.
- 3D LiDAR scanning of built structures — workflow and deliverables.
- 3D scanning for stockpile volume calculation — point data applied to measuring stored material volumes.
Preparing a 1:500 topographic and existing-conditions deliverable for a site or an operating facility in Ho Chi Minh City or elsewhere in Vietnam? Send 3DSCAN your survey scope and our engineers will propose a suitable equipment combination and the list of records you will need to supply.
Contact 3DSCAN Hotline: 0938 309 808 · Email: lienhe@3dscan.vn