
3D Scan Volume Calculation – Efficient Stockpile Management Solution from 3DScan.vn
3D scan volume calculation (volume/stockpile measurement) is a method of digitizing yards/stockpiles using Laser Scan and/or UAV LiDAR / UAV RTK–PPK imagery, generating high-accuracy point clouds and 3D surfaces to measure volume, inventory stock, and reconcile financial reports. The solution from 3DScan.vn helps companies in mining, construction materials, cement, coal, agricultural products, logistics, etc. to monitor stock fluctuations quickly – accurately – transparently, reducing risk and optimizing operating costs.
Key strengths: target error is only about ~1–3% (depending on terrain, material surface and point density), safe because direct contact is minimized, fast (scan thousands of m² in a few hours), 3D data is easy to verify (sections, boundaries, elevation difference maps) and can be reused for monthly/quarterly inventory cycles.
Contact 0938 309 808 for quotation & schedule

Laser scanning stockpile inside Insee Thi Vai plant warehouse
Why is 3D scanning the optimal choice for volume calculation?
- True field accuracy: dense, continuous 3D data; surface models do not rely on geometric assumptions (cones, prisms, etc.) like manual measurements.
- Fast – safe execution: UAVs/laser operate from a distance, shortening stockyard shutdown time; minimizing climbing and exposure on unstable slopes.
- Transparent – verifiable: all point cloud / mesh data is archived and can be reopened for cross-checking, extracting sections, and viewing stockpile boundaries at any time.
- Cost-effective: reduces inventory discrepancies, controls loss; standardizes reporting workflow to optimize manpower.
- Scalable: applicable from small yards to large mines; multiple stockpiles at once; easy to schedule periodic inventories.
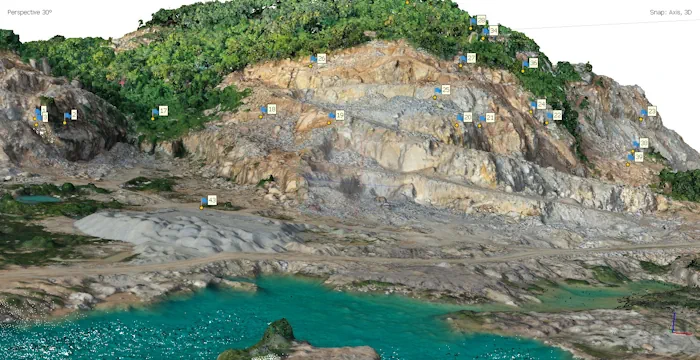
Volume calculation for limestone quarry of Fico cement plant, Vung Tau
What is 3D scan volume calculation? Method overview
The core objective is to reconstruct the actual surface of the stockpile/quarry at the time of survey. From this surface, compared with the reference surface (ground, design elevation, previous cycle), the volume can be computed and converted into mass using the material’s bulk density.
UAV LiDAR
UAVs equipped with LiDAR directly scan the surface using laser pulses, achieving high point density and robust quality on complex materials (riprap, coal, stockyard piles). Advantages: less dependent on lighting, performs well on dark, rough surfaces. Combined with RTK/PPK and GCPs (ground control points) to improve absolute accuracy.
UAV RTK–PPK imagery (Photogrammetry)
High-overlap flights are captured and processed by photogrammetry software to reconstruct point clouds, orthophotos and DSM/DTM surface models. Advantages: cost-effective, highly visual imagery that facilitates validation; suitable for open stockyards and large areas.
Terrestrial Laser Scan (TLS)
Static scanners are placed at multiple positions with 360° rotation, capturing point clouds with millimeter-level detail. Best suited for indoor warehouses, sheds, silos or areas requiring extremely high resolution and minimal occlusion. TLS is also a complementary method to “patch” difficult zones when using UAVs.
Coordinate systems, GCPs & elevation benchmarks
All data is constrained by GNSS/GCP marks, elevation benchmarks and/or existing survey control networks. This consistency is the foundation for accurate comparison between inventory cycles.
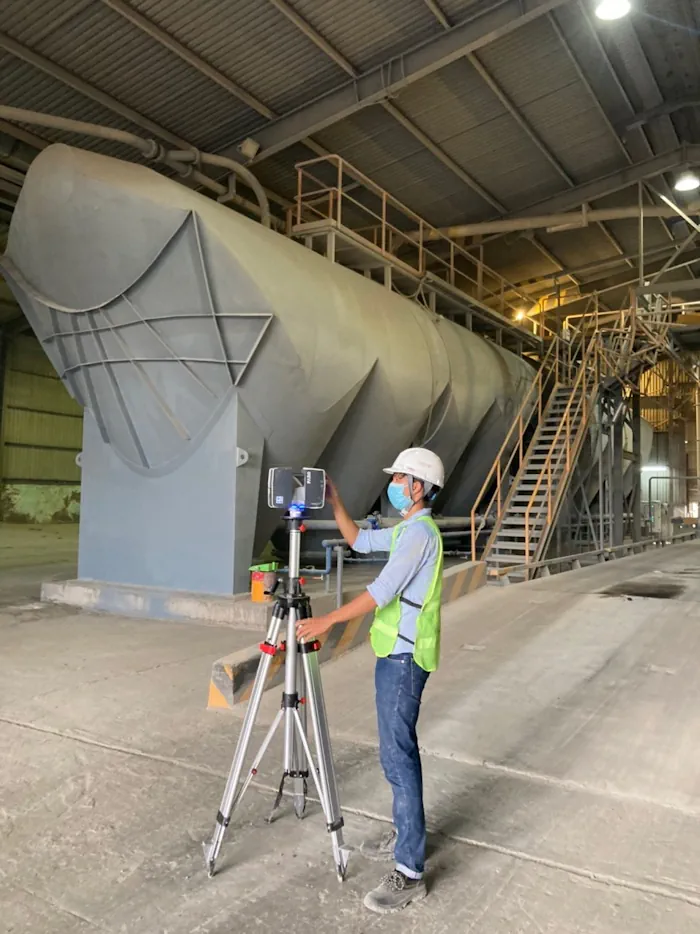
3D laser scanning for volume calculation of cement silo stock in Insee warehouse, Can Tho
Accuracy and influencing factors
Under typical conditions, 3D scanning for inventory achieves an overall error of about 1–3%. Main influencing factors include:
- Slope & surface characteristics: fine, stable granular materials give better results than rough surfaces with large voids.
- Point density & flight/scan paths: the higher the overlap of images/scan lines, the more reliable the reconstructed surface.
- Calibration & data registration: GNSS/IMU quality and procedures for station registration and GCP constraints.
- Base surface definition: accurately separating yard ground (base surface) to avoid biasing volume results.
- Volume-to-mass conversion factor: using on-site measured bulk density according to corporate standards.
Standard workflow at 3DScan.vn
- Requirement intake & preliminary survey: define objectives (rapid measurement – reconciliation – periodic inventory), measurement scope, target accuracy and site conditions (safety, no-fly zones, power).
- Scanning plan: select technology (UAV LiDAR, UAV RTK–PPK imagery, TLS), flight paths/station positions, target point density, GCP/benchmark plan, suitable weather windows.
- Data acquisition: carry out flights/scans as planned; perform quick on-site quality checks (coverage, noise, outliers); supplement occluded areas if needed.
- Point cloud processing: registration, noise filtering, coordinate adjustment; surface classification (stockpile, base, retaining walls…); building 3D mesh/DSM; controlling registration errors.
- Base surface & stockpile boundary definition: build the base surface (clean ground, design elevations or previous cycle surface) and accurate boundaries for volume calculation.
- Computation & reconciliation: calculate volume/mass, generate sections and elevation difference maps, report discrepancies vs. previous cycle and vs. accounting records; perform QA/QC.
- Handover & training: PDF/Excel reports, 3D data (E57/LAZ, OBJ/FBX/GLB), orthophotos, DSM/DTM (GeoTIFF), links to online 3D viewers; on-site verification guidance.
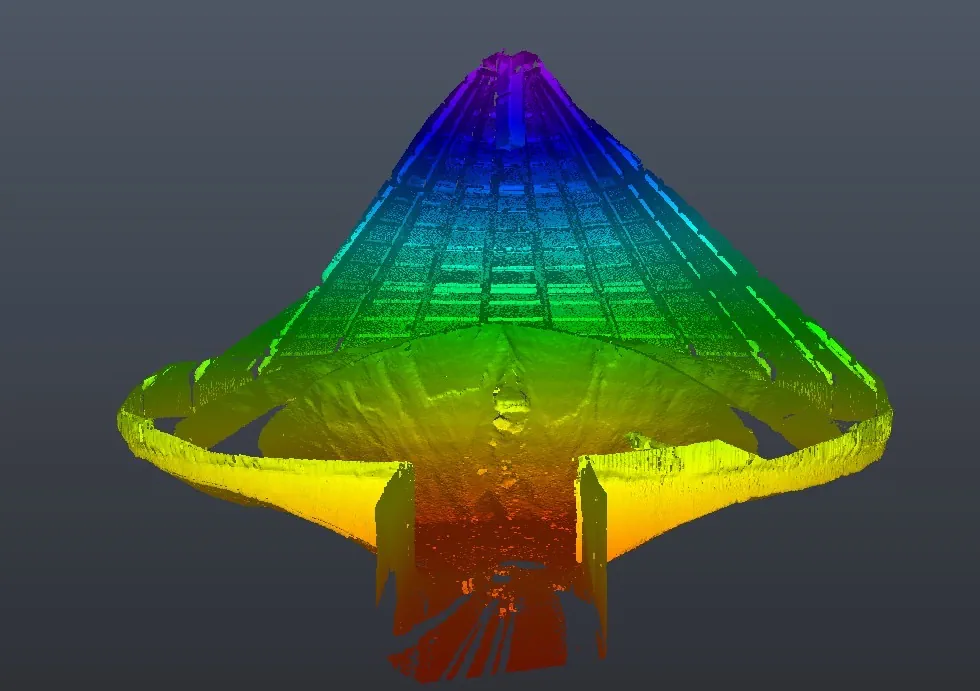
Laser scan result for calculating remaining cement volume at Insee Thi Vai plant
Deliverables & data formats
- Volume reports: volume/mass tables per stockpile, cycle comparison charts, technical comments; PDF/Excel files.
- Point clouds: E57/LAZ with clearly defined coordinate systems; can be classified (stockpile/base/structures).
- 3D surfaces: 3D mesh (OBJ/FBX/GLB), DSM/DTM (GeoTIFF); high-resolution orthophotos.
- Sections & boundaries: DXF/DWG and PDF for quick verification.
- Online viewer: web link (Cesium/Potree) to view 3D data, measure, toggle layers and download reports.
Typical application scenarios
Mining sites
Monthly/quarterly inventory of overburden and ore; reconciliation of cut/fill volumes; monitoring slope changes and generating elevation difference maps to optimize mining plans.
Cement and thermal power plants
Inventory management of clinker, coal, limestone, additives in open/closed stockyards; control receiving and dispatching; basis for financial reporting and auditing.
Construction material yards
Simultaneous monitoring of multiple sand, aggregate, gravel stockpiles; inter-cycle comparisons to detect abnormal discrepancies and reduce loss.
Agricultural products & animal feed
Inventory of corn, wheat, soybeans, etc. in silos/dome warehouses; building accurate top surfaces of commodity piles for precise volume calculation.
Logistics & seaports
Bulk cargo management, cross-checking loading/unloading figures; transparent volume reports for all stakeholders.
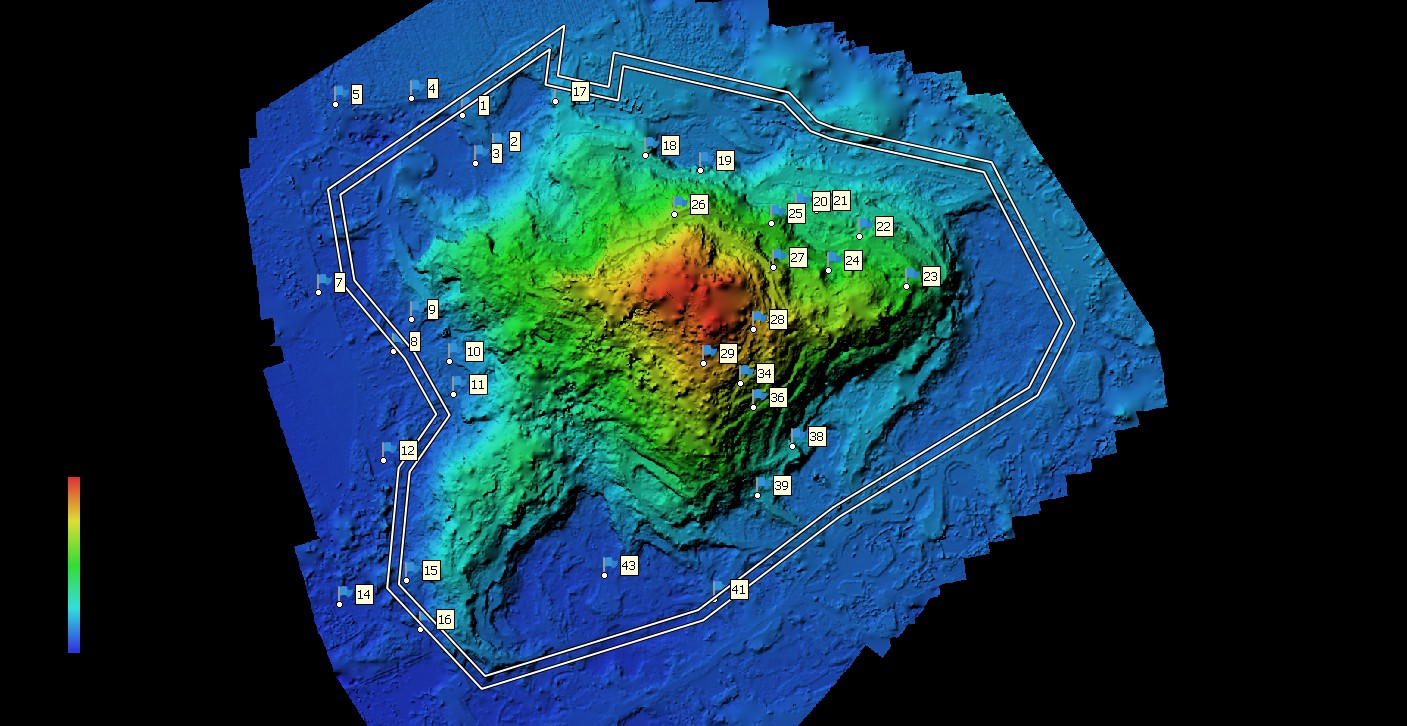
Limestone quarry volume calculation from DEM
Comparing 3D scanning with manual/traditional measurement
- Method: 3D scanning reconstructs actual surfaces; manual measurement assumes idealized shapes → large errors on complex surfaces.
- Accuracy: 3D scanning typically reaches ~1–3%; manual measurements vary greatly between surveyors and pile geometries.
- Speed & safety: 3D scanning is faster and reduces exposure; manual measurements are time-consuming and risky.
- Repeatability & verification: 3D data can be stored long-term → easy cross-checking; manual measurements are hard to reproduce.
- Lifecycle cost: 3D scanning is optimal for periodic inventories, especially with many stockpiles/large areas.
QA/QC rules & technical risk management
- Occlusion control: plan multiple flight directions/scan positions; use oblique angles to “see” slopes.
- Standardized coordinate systems: clearly defined GCPs/benchmarks; documenting metadata (EPSG, vertical datum) in the deliverables.
- Noise removal: filter out outliers (excavators, conveyors) before building calculation surfaces.
- Base surface definition: use clean ground/previous cycle/design surface; do not use top of obstacles as base.
- Cross-checking: select representative stockpiles for control measurements or validate volumes using multiple internal methods.
Representative projects by 3DScan.vn
- Clinker/cement stockpile inventory for plant networks: scheduled periodic scans, Excel/PDF reports aligned with audit standards.
- 3D stockpile scanning of coal at ports: UAV LiDAR deployment, online 3D viewers for multi-party reconciliation.
- Quarterly monitoring of large construction material yards: mass stockpile measurements, consolidated discrepancy analysis and recommendations for optimizing traffic flows.
- … and many other projects in mining, agricultural products and logistics.
Scale & deployment time
Field work typically takes from a few hours to 1–2 days, depending on area, number of stockpiles and flight/scan conditions. Processing and reporting usually take 1–3 working days. With periodic service packages, timelines are standardized (e.g., day T survey, day T+1 preliminary report, day T+2 reconciliation & finalization).
Periodic inventory workflow (monthly/quarterly)
- Fixed scheduling according to accounting cycles; define time windows to close/open stockyards for scanning.
- Standardizing survey areas: clean surfaces, temporarily halt dispatching at surveyed stockpiles to avoid intra-shift volume changes.
- Consistent data acquisition (same flight paths/overlap, same coordinate system).
- Processing & comparison with previous cycles; generate elevation difference heatmaps to identify areas of change.
- Reporting & handover: update consolidated Excel dashboards, assign viewer access permissions for management, accounting and operations.
Frequently Asked Questions (FAQ)
What is the accuracy of 3D scanning in volume calculation?
Typically around 1–3%, depending on terrain, slopes, material characteristics, point density and survey conditions. 3DScan.vn will recommend appropriate configurations to meet your target error.
How long does one inventory cycle take?
Field work usually takes from a few hours to 1–2 days; processing and reporting typically require 1–3 days, depending on scale and number of stockpiles.
What are the deliverables?
PDF/Excel reports (volume, mass, cycle differences), 3D data (point clouds E57/LAZ, 3D meshes OBJ/FBX/GLB), orthophotos & DSM/DTM (GeoTIFF), sections/boundaries (DWG/PDF), plus online 3D viewer access.
Can this be implemented on a monthly/quarterly basis?
Absolutely. We offer periodic inventory packages to continuously track stock fluctuations and optimize per-cycle costs.
Does 3D scanning completely replace manual measurement?
In most cases, 3D scanning is superior in speed, safety and reliability. Manual measurement should be reserved for local cross-checks or when site conditions do not allow scanning or flying.
Quick glossary
- Point Cloud: a set of 3D points representing real-world surfaces.
- DSM/DTM: digital surface model / digital terrain model.
- Orthophoto: geometrically corrected aerial image with uniform scale.
- GCP: ground control point used to constrain coordinates.
- Bulk Density: loose bulk density used to convert volume → mass.
Safety & legal compliance
- Compliance with UAV flight safety rules and restricted areas; obtaining permits where required.
- Establishing safe working zones: limiting personnel/vehicles in scanning areas.
- Data security: controlled access, watermarks on viewers and governed data storage.
Consultation & quotation
Do you need a transparent, fast and accurate stock inventory solution? Let 3DScan.vn help you design a workflow that seamlessly integrates with your existing reporting systems.
Công ty TNHH Công nghệ 3DSCAN
Tax code: 0318974406
Address: 730/30 Huynh Tan Phat, Tan Phu Ward, District 7, Ho Chi Minh City
Phone: 0938 309 808
Email: lienhe@3dscan.vn
Website: 3dscan.vn
```