

As-Built, Topographic and Utility Connection Survey with 3D Laser Scanning and UAV at Thống Nhất Stadium
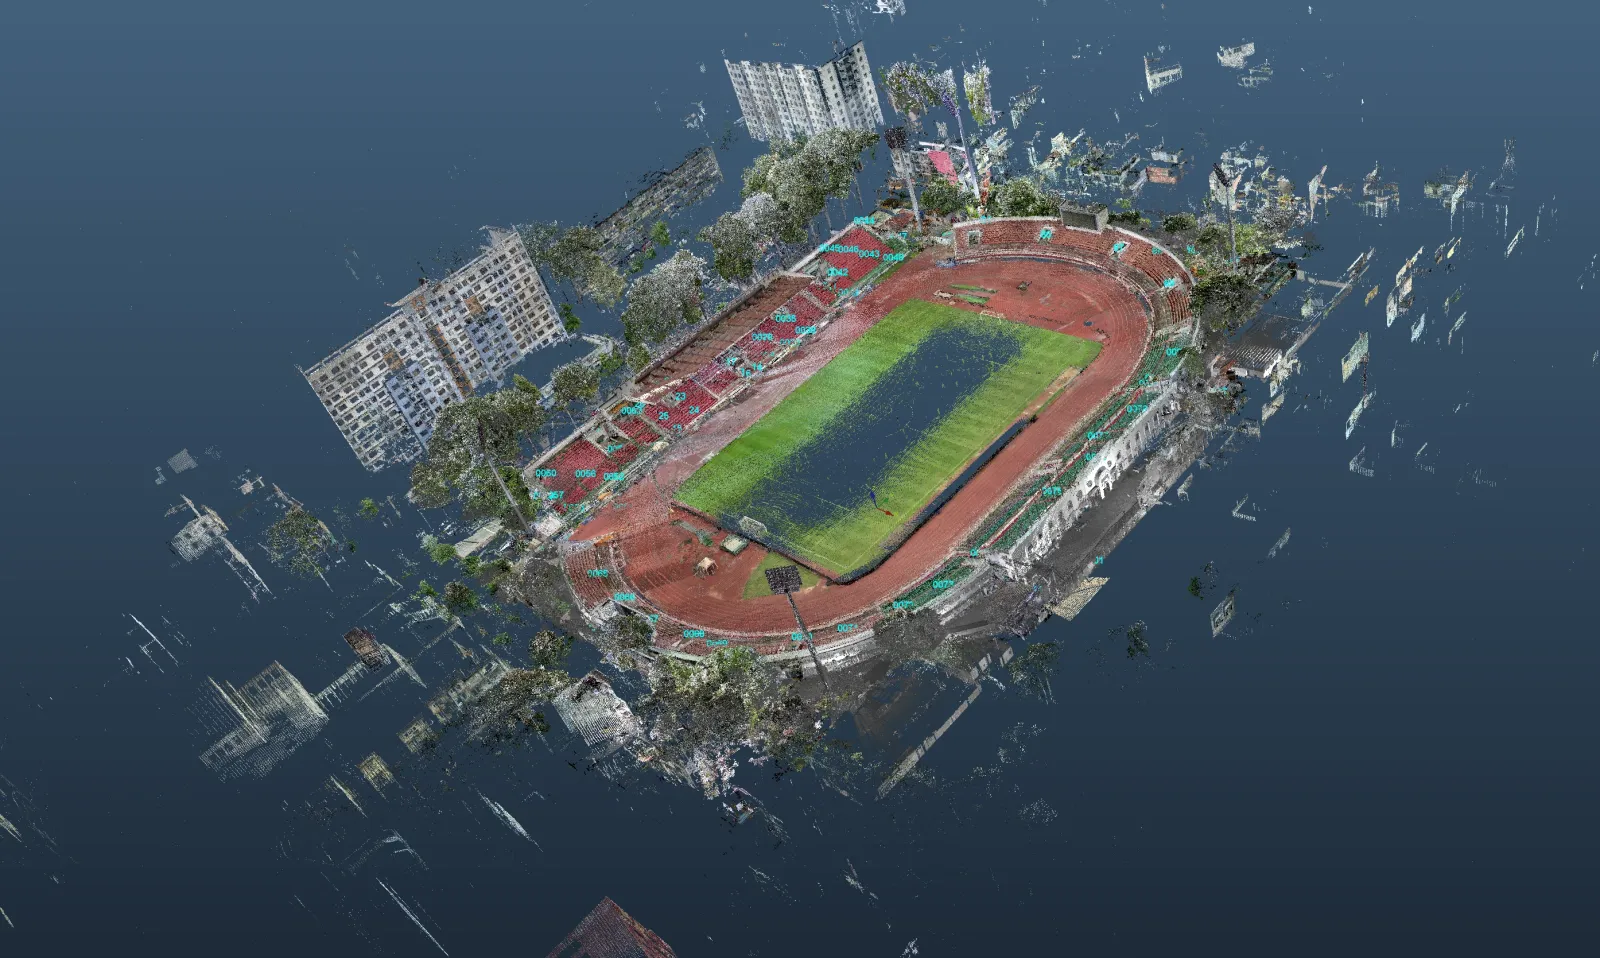
3DSCAN Technology Company Limited carried out the as-built, topographic and utility connection survey for the renovation and extension of Stand B at Thống Nhất Stadium (138 Đào Duy Từ, District 10, Ho Chi Minh City) using three combined methods: UAV RTK photogrammetric flight, terrestrial 3D laser scanning (TLS), and GNSS-RTK measurement combined with a total station. Deliverables include a 1:500 topographic plan with 0.5 m contours across 35,936.7 m², A0-format as-built location and architectural drawings, and a merged UAV + TLS point cloud georeferenced to the VN-2000 system and ready for BIM modelling. The topographic scope followed the 3D topographic surveying with UAV workflow that 3DSCAN applies to urban infrastructure projects.
Request a sports facility survey consultation
Renovating a stand still in use: the old drawings are no longer the truth
The owner's problem was not re-measuring for the sake of paperwork, but designing a renovation on a structure that has been repaired many times over. A stadium in operation for decades typically carries three discrepancies at once: stand tread levels that deviate from the original drawings; railings, emergency exits and service areas that have been altered; and buried utilities around the pitch with no records matching the actual conditions.
The requirements for Stand B therefore fell into four groups with different geometric natures — a 1:500 topographic plan, the site boundary, the architectural geometry of the stand, and the connection routes for roads, power, water, drainage and telecoms beyond the stadium perimeter — none of which a single instrument can solve.
A stadium holds three kinds of geometry, and no single instrument captures them all
The most important technical decision was made during the preliminary site visit: divide the site by geometric character, then assign a measurement method to each zone, rather than committing to one instrument for the whole project. The stadium contains all three distinct geometries: wide open surfaces, enclosed spaces obstructed on several levels, and discrete objects that each require an absolute coordinate.
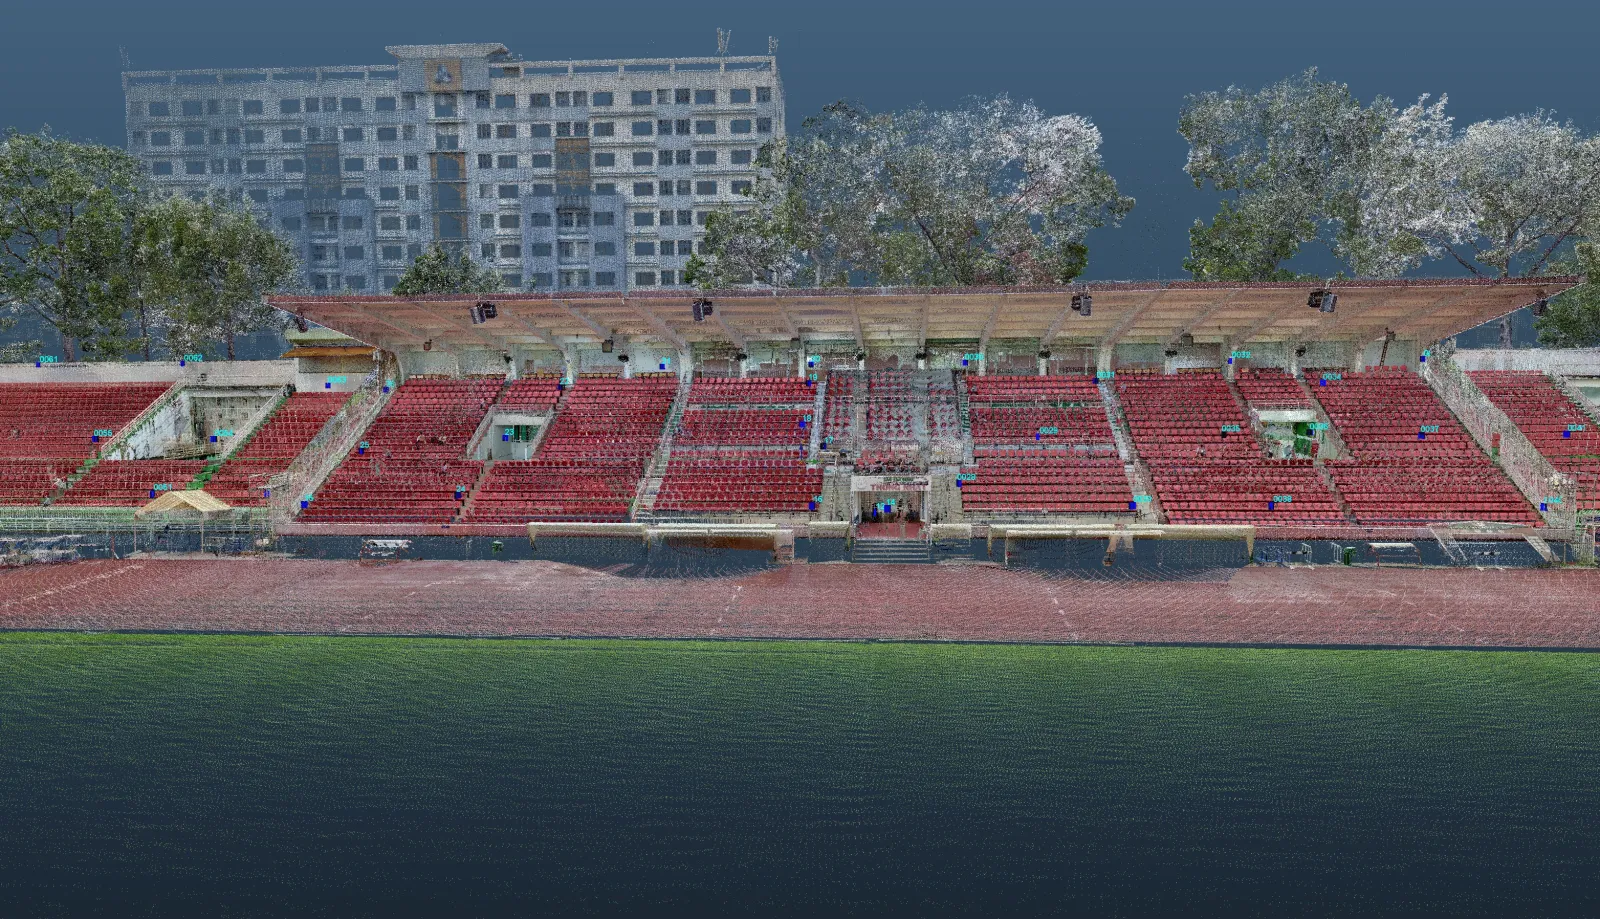
Principle cross-section: the UAV covers the exposed surfaces and the ~20 m strip beyond the boundary, 3D laser scanning covers everything shielded by the roof, and the two sources meet in the overlap zone
Exposed surfaces and the connection strip: UAV RTK
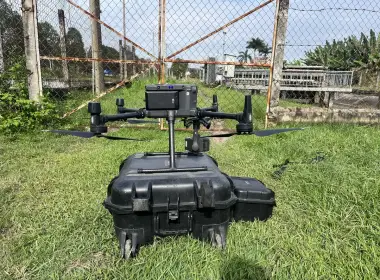
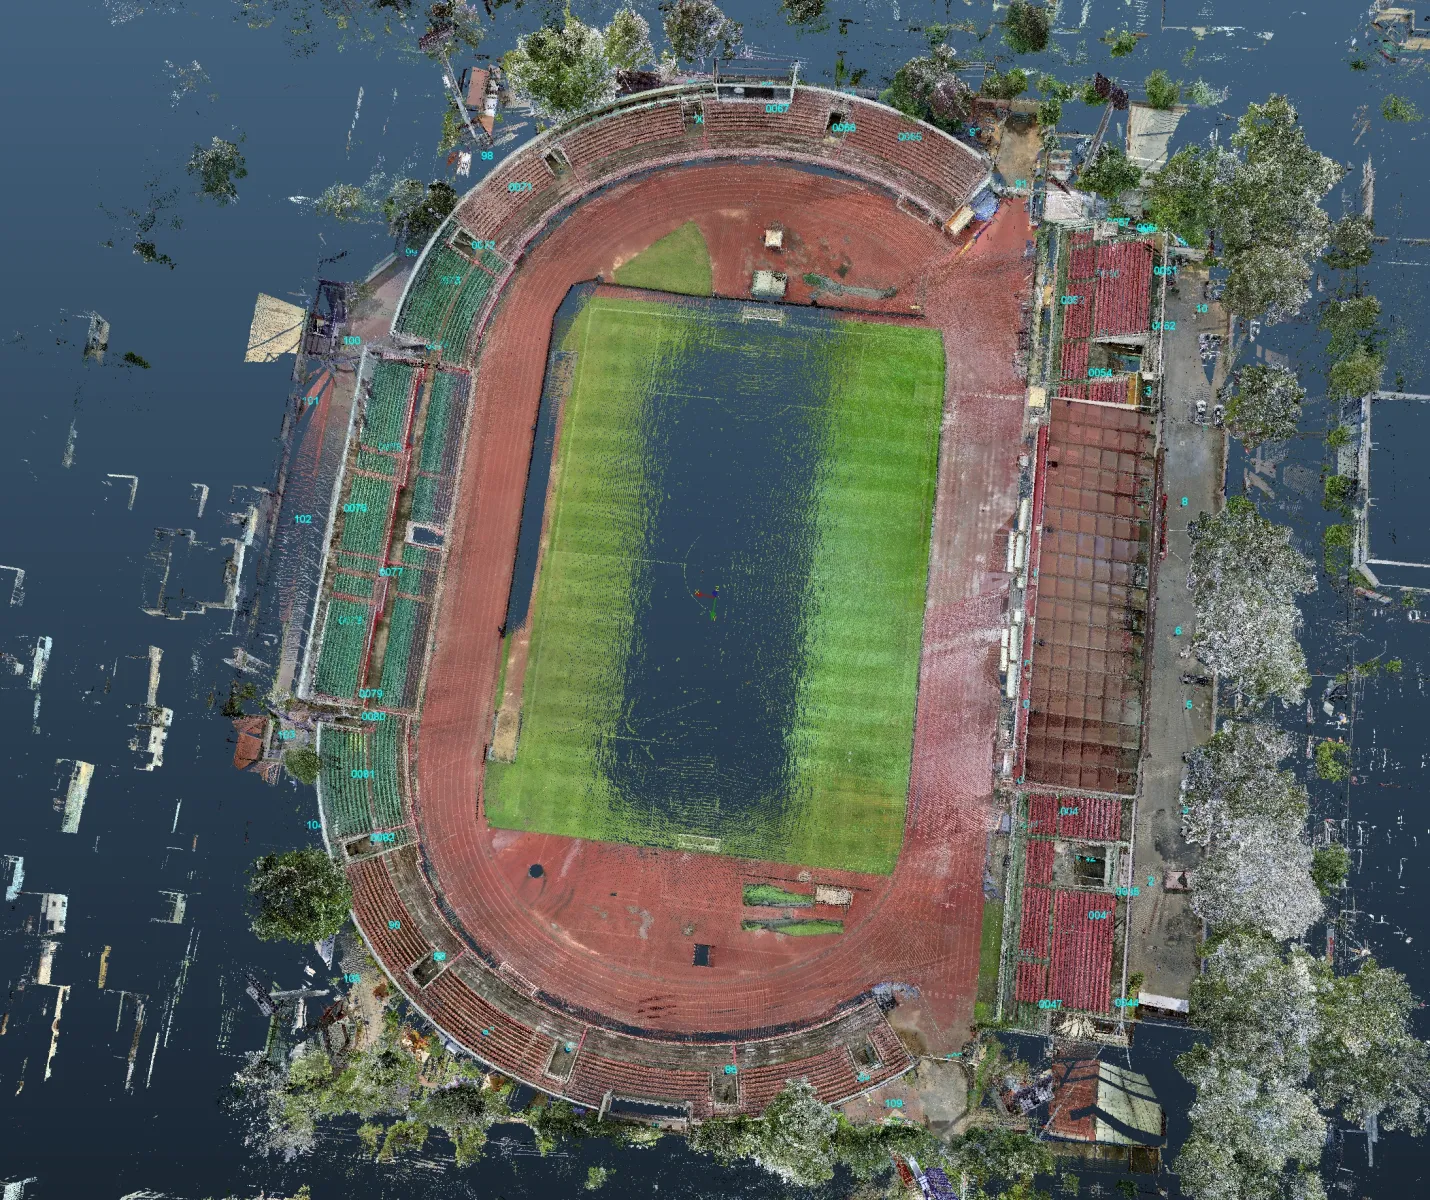
UAV RTK — a Phantom 4 RTK working alongside a GNSS receiver set up as an on-site base — covered the pitch, the stand roof surface, the open ground around the stadium and the buffer strip of roughly 20 m on each side beyond the boundary, the data without which the connection routes cannot be matched to existing infrastructure. The imagery was processed into an orthophoto and DSM/DTM, georeferenced to VN-2000 and the national height datum, forming the base for the 1:500 plan.
Stand interior and under-structure: 3D laser scanning
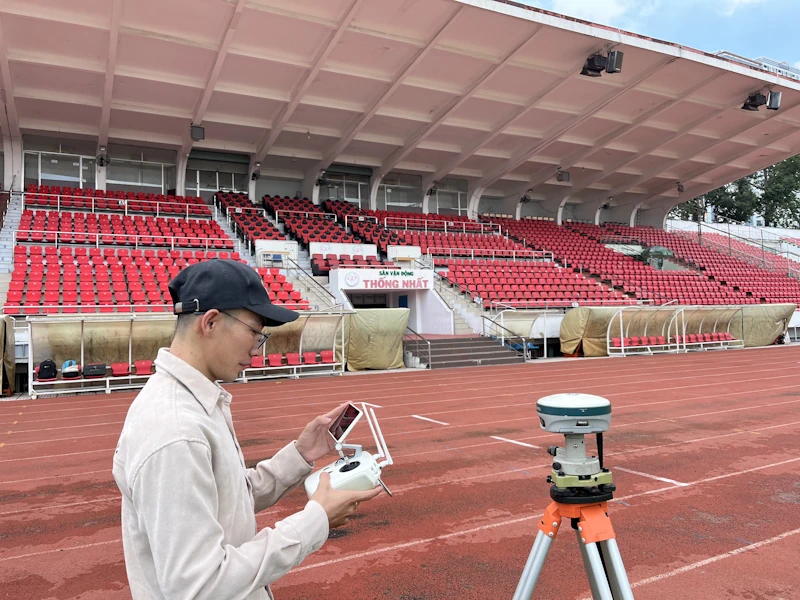
What the UAV cannot see — the treads beneath the roof, railings, emergency exits, corridors and service areas inside Stand B — belongs to the terrestrial 3D laser scanner. 3DSCAN set up multiple stations both inside and outside the stand, using cloud-to-cloud registration where the geometry was distinctive enough and switching to target-based registration where surfaces were too uniform — the same approach as 3D laser scanning for architectural as-built records on buildings still in use.
Site boundary and technical utilities: GNSS-RTK and total station
Boundary marks, building edges, power poles, manholes and culvert mouths cannot be extracted from a point cloud: each needs an absolute coordinate that can be defended in the record. 3DSCAN established a Class IV control network of three marks, DC1, DC2 and DC3, with both VN-2000 coordinates and elevations, ran GNSS-RTK observations on that network, then used a total station to traverse into the positions where the stand blocks satellite signal.
Basis for choosing a measurement method per zone
| Zone | Geometric constraint | Method selected | Output obtained |
|---|---|---|---|
| Pitch, stand roof surface, open ground | Wide, continuous, unobstructed from above | UAV RTK, georeferenced to VN-2000 marks | Orthophoto, DSM/DTM, base for the 1:500 plan |
| Stand B treads, railings, emergency exits | Repeating treads, each blocking the view below | Multi-station 3D laser scanning, cloud-to-cloud | Level of each tread, railing geometry |
| Under-stand space, corridors, service areas | Enclosed space with no GNSS signal | Target-based 3D laser scanning, total station traverse | Plans and sections, data for Scan to BIM |
| Site boundary, power poles, manholes, culverts | Discrete objects needing absolute coordinates | GNSS-RTK and total station on the Class IV network | A0 as-built location drawing, boundary record |
| ~20 m buffer strip beyond the boundary | Must match existing infrastructure outside | UAV RTK, total station infill under tree canopy | Road, power, water and telecom connection routes |
On site, the hard part is not the area but the number of blocked sightlines
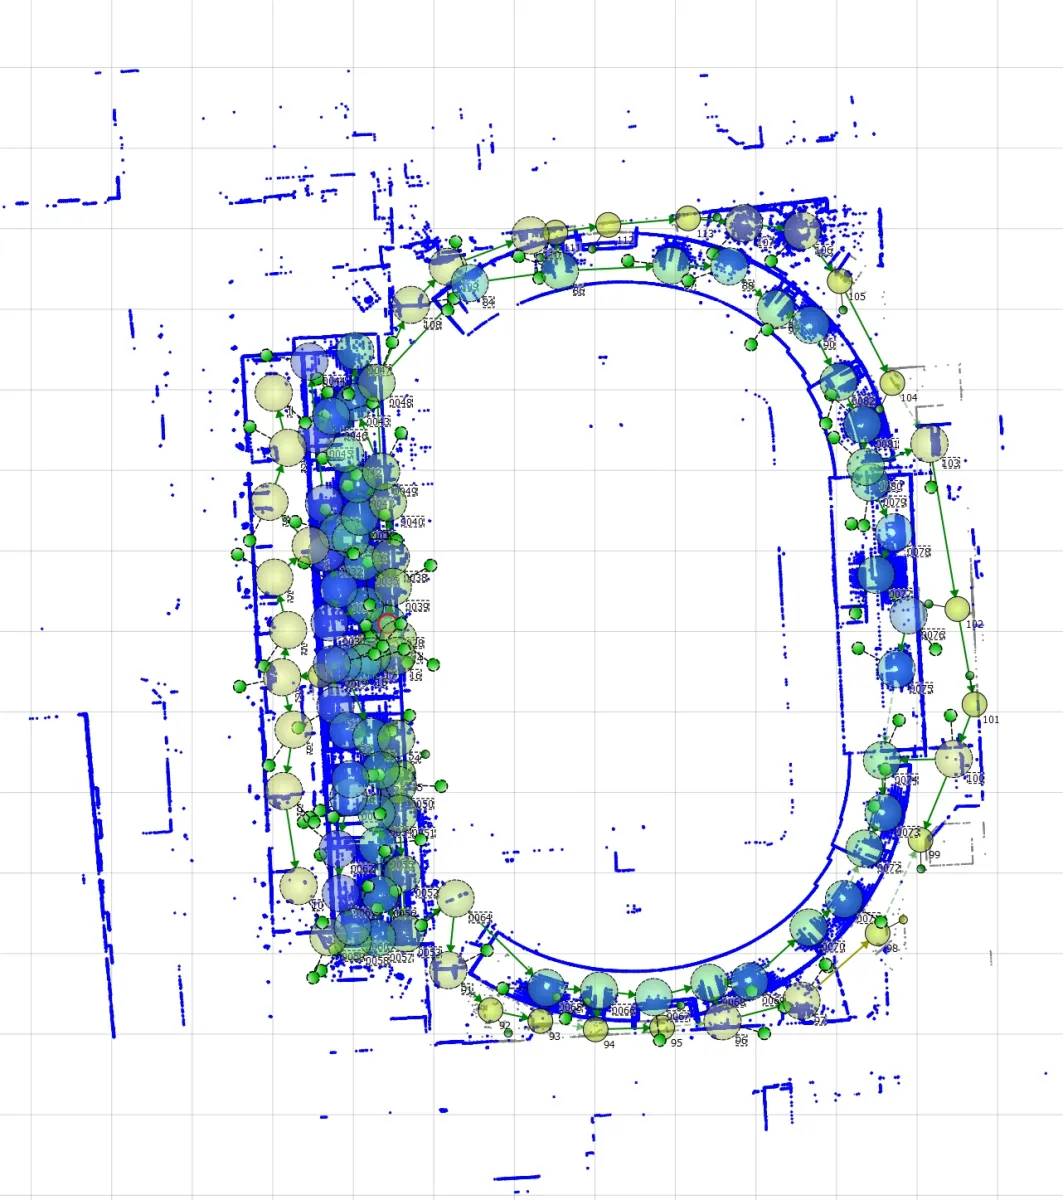
The number of scan stations a stand requires is not proportional to its floor area but to the number of obstructed zones. The structure of Stand B creates three overlapping layers of obstruction: the roof blocks all sight from above; each tread hides the face of the tread below it when scanned from a distance; and the beam-and-column system supporting the roof divides the space into bays with no line of sight between them.
“A stand is hard not because it is large, but because it repeats: identical treads one after another, each blocking the sightline to the one below. The station count is therefore not decided by area but by the number of blocked sightlines — and that is a figure you can only count once you are on site.”
— Phan Tiên Duyên, Project Manager, 3DSCAN
The consequence is the station layout: instruments were set up on the pitch, on the treads themselves and under the stand, with every adjacent pair sharing enough distinctive overlap to register reliably; in bays with nothing but flat concrete, the crew applied targets. The positions of the three marks DC1, DC2 and DC3 followed the same logic — open enough for stable GNSS reception, yet visible from the total station setups traversing into the stand.
From several disconnected datasets into a single coordinate system
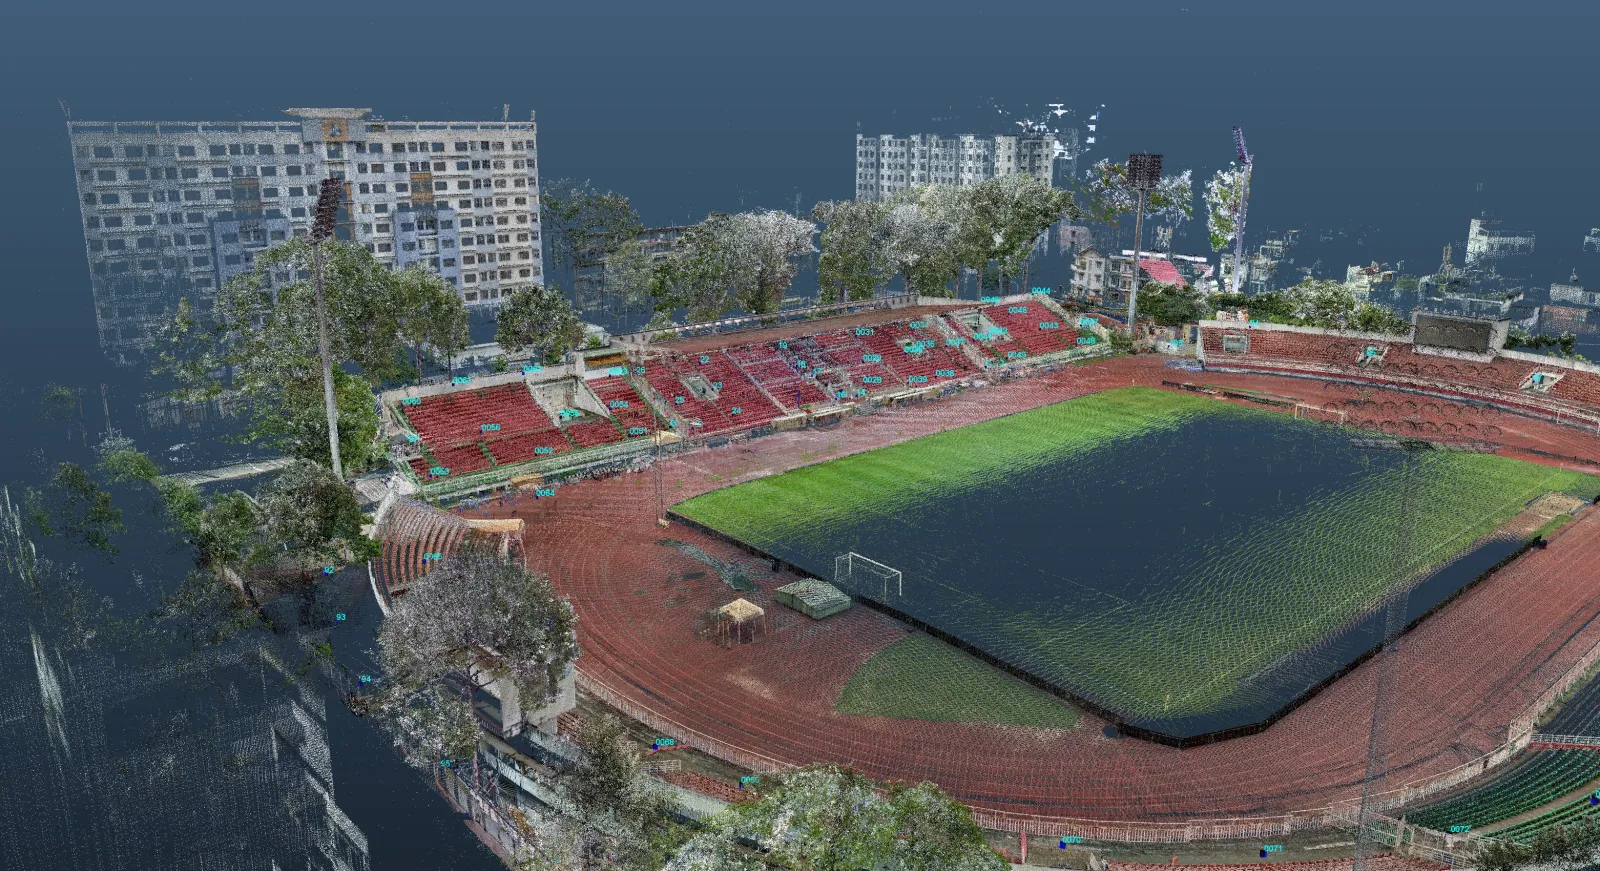
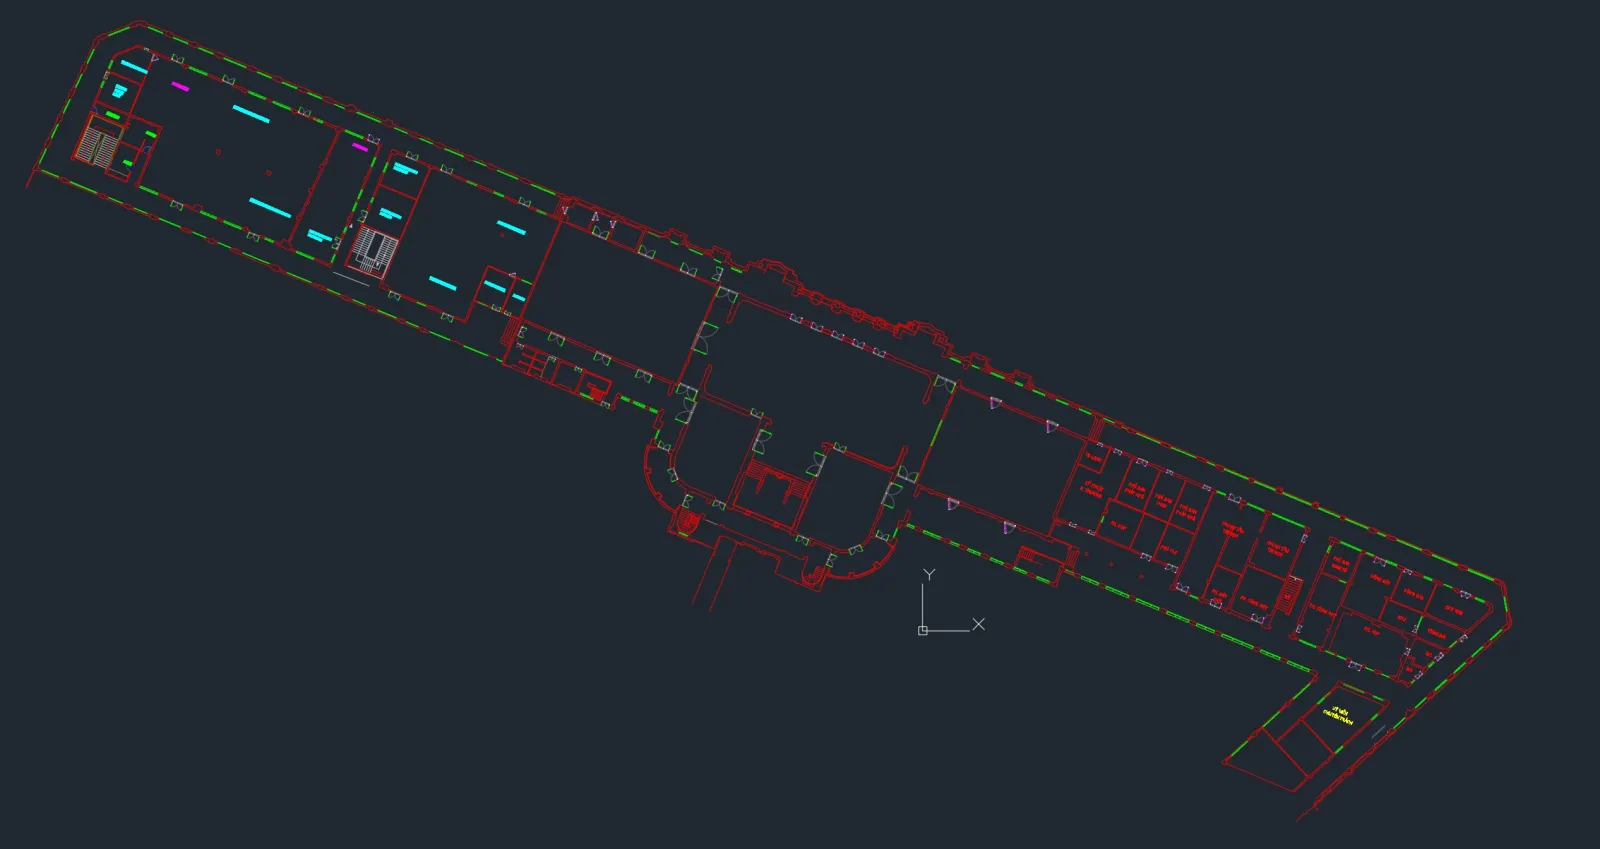
The value of the project lies in all three data sources living inside one single VN-2000 coordinate system, rather than three handsome datasets that do not line up. The processing chain ran in strict order: adjust the Class IV control network first, georeference the UAV image block to that network, register the 3D laser scanning stations into one continuous point cloud, then fit the TLS block to the UAV block in the overlap zone.
After merging, the data was cleaned, classified and digitised into the topographic plan and as-built drawings, following the workflow behind the 3D modelling with UAV and laser scanning service.
The figure the whole record rests on: point position error ≤ 0.003 m
The quality of a survey record is decided by the control network, not by the instrument's catalogue figures. The project's Class IV network was adjusted to TCVN 9401:2012, giving a typical point position error of ≤ 0.003 m; the levelling loop through the marks closed within tolerance. The 1:500 plan, the A0 drawings and the merged point cloud all inherit their absolute accuracy from these three marks.
This is also where survey records are commonly misread: absolute accuracy — where the data sits within VN-2000 — is decided by the control network, while relative accuracy between two adjacent details depends on registration quality. Very clean data can still be displaced as a whole block if the network is weak — which is why 3DSCAN fixes the network first and scans second.
One survey, many downstream uses
- 1:500 topographic plan — 0.5 m contours, approximately 35,936.7 m².
- Control marks DC1, DC2, DC3 — VN-2000 coordinates and elevations with adjustment results.
- A0 as-built location and architectural drawings — site boundary and existing structures.
- Utility connection routes — roads, power, water, drainage and telecoms beyond the stadium perimeter.
- Merged UAV + TLS point cloud — E57, LAZ and RCP, opening directly in design software.
- CAD data (DWG/DXF), 3D mesh, GeoTIFF orthophoto and DSM/DTM for the whole area.
- Technical report and site photo record — method statement, coordinate and elevation tables.
What this data does that a 2D drawing cannot
For the design team, the merged point cloud allows the stand structure to be rebuilt exactly as it stands and clashes to be checked before construction: whether a new element has enough clear height beneath the roof beams, whether the emergency exit still meets its required width after renovation — answered on the data itself. This is the input to the Scan to BIM workflow.
For reviewers and the owner, the as-built drawings together with the control network are the basis for verifying quantities and confirming boundaries. The dataset can also be standardised and converted into GIS data to manage the whole site's utilities by layer.
Three lessons 3DSCAN took from this project
Count the obstructed zones before quoting the scope. On a roofed sports facility, the station count comes from the number of bays with blocked sightlines, not from the square metres — a single preliminary site visit saves far more time than it costs.
The buffer strip beyond the boundary is where the surprises are. The 20 m outside the boundary is often treated as a minor item, yet that is exactly where the road, power and water routes must match existing infrastructure — missing data there usually forces a supplementary survey.
Choose control marks by sightline, not on paper. A mark that looks ideal on a drawing but sits in the shadow of the stand roof is useless to both GNSS and the total station — it has to be fixed on site.
Capability for sports facilities still in operation
The Thống Nhất Stadium project shows what 3DSCAN pursues in every survey record: data that can be verified — from a control network with published adjustment results, through a single coordinate system, to a deliverable set the design team can open and use straight away. Headquartered in Ho Chi Minh City, 3DSCAN takes on surveys of stadiums, indoor arenas and operating facilities that need as-built digitisation without interrupting activity, through its 3D laser scanning service for buildings and structures.
Related 3DSCAN projects
Need an as-built survey, a 1:500 topographic plan or point cloud digitisation for a stadium, arena or sports facility still in operation? Send us the project scope and 3DSCAN will advise on a UAV + 3D laser scanning approach and quote against the actual volume of work.
Contact 3DSCAN Hotline: 0938 309 808 · Email: lienhe@3dscan.vn